Mass public shootings in the US remain a cause for concern for policymakers and the public alike. In 2018, following the mass shootings at Marjory Stoneman Douglas High School in Parkland, Florida, and Santa Fe High School in Santa Fe, Texas, the Regional Gun Violence Research Consortium released its flagship policy brief contextualizing more than 50 years of data on these events, with updates published in 2021 and 2023.
The Consortium also launched its Mass Shooting Factsheet in 2018, which is designed to provide policymakers and the public with a snapshot of key findings and insights about mass shooting incidents. This month (June 2025), we are pleased to share the relaunch of this resource.
A key feature of this update is the new interactive event map, which geospatially reflects each incident included in the database along with event-level information (e.g., date, location type, casualty counts). We have also added new data points such as the distribution of days and times of these events to provide more context about when mass public shootings are occurring in addition to where.
Another important change to the factsheet is that updates will now be made weekly as new incidents occur or as new and additional information on previous events becomes available. This means that users will be able to access near real-time trends about the mass public shootings phenomenon.
Updated Insights on Mass Public Shootings
The previous release of the factsheet highlighted trends from 1966 to 2022. The current release now includes updated findings through the publication date of this blog, drawing on more than two additional years of data (January 1, 2023, through June 6, 2025). Additionally, using a novel open-source search protocol designed by Emily Greene-Colozzi, we have been able to identify 25 additional incidents occurring between 1966 and 2022 to ensure the most complete set of events possible.
DEFINITION
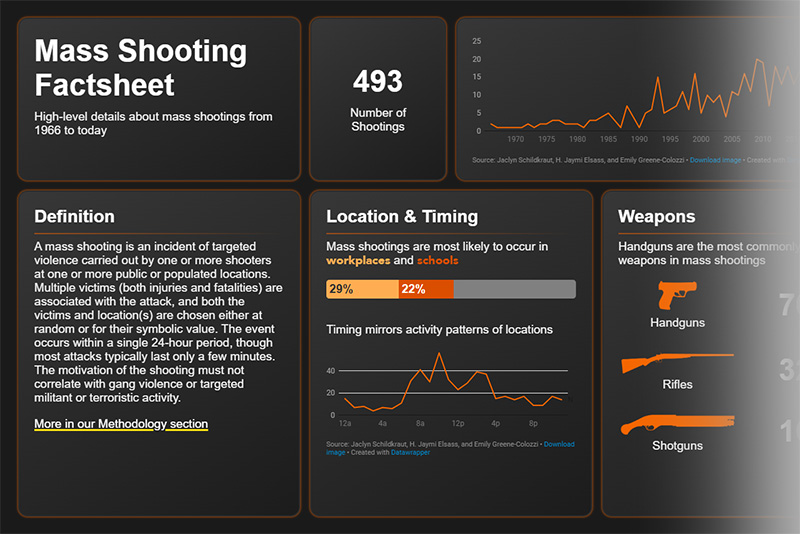
A mass shooting is an incident of targeted violence carried out by one or more shooters at one or more public or populated locations. Multiple victims (both injuries and fatalities) are associated with the attack, and both the victims and location(s) are chosen either at random or for their symbolic value. The event occurs within a single 24-hour period, though most attacks typically last only a few minutes. The motivation of the shooting must not correlate with gang violence or targeted militant or terroristic activity. (Schildkraut & Elsass, 2016)
Although the comparisons drawn in the findings below—between the 1966–2022 data and the more recent 2023–2025 data—reflect the previously reported findings that did not include these cases, the new factsheet and future releases do and will incorporate them. We also include a set of supplemental analyses at the end of this blog to compare trends for 1966 to 2022 between our previously reported findings and the updated data with the additional cases included.
With this data, we can assess how mass shootings continue to evolve over time. Some key findings from the most recent data update (2023–present) include the following:
- There were 16 mass public shooting incidents in 2023 and six in 2024 that met the definitional criteria of the database. Despite these numbers being slightly lower than those of the immediately prior years, the overall trend continues to increase over time, as depicted in Figure 1 below. To date in 2025 (through June 6), there have already been five mass public shootings, putting the US on track for a number of incidents similar to years past.
Yearly Occurence of Mass Public Shootings, 1966 to 2025
- The 27 incidents that occurred since the beginning of 2023 claimed the lives of 101 people and left 136 others injured. While the average number of fatalities per incident (3.7) is in line with the average across shootings between 1966 and 2022 (3.6), the average number of injuries has decreased. In our previous analyses, we showed that the average number of individuals sustaining nonfatal gunshot injuries was 8.9 (including the 2017 Las Vegas shooting; excluding that incident as an extreme outlier, the average was 7.8). In the latest cases—2023 to present—the average number of individuals sustaining nonfatal gunshot injuries per incident was 5.0, suggesting that fewer people are being injured in more recent mass public shootings, thereby also decreasing the total number of casualties (fatalities plus injuries).
- Schools continue to be one of the primary location choices for perpetrators of mass public shootings. More than one out of every four mass shootings since the start of 2023 (25.9 percent) occurred at an educational institution. Workplaces, which are the most commonly selected location of mass shootings, across all years of the data (representing 27.8 percent of all incidents since 1966), were the site of three incidents (11.1 percent) in the same period.
- Characteristics of perpetrators continue to remain consistent. Across the newest included cases (2023 to present), the majority of offenders were male (92.6 percent) and White (55.6 percent). The average age of perpetrators was slightly higher than our previous analysis at 35.3 years (versus 33.2 years for 1966–2022), with four of the perpetrators over the age of 50.
- In these most recent cases, all 27 perpetrators carried out their attacks alone. Although historically, most mass shooters act alone, there were 10 incidents (2.2 percent of cases) in the earlier data (1966–2022) involving two or more perpetrators.
- Most patterns of weapon use by mass shooters remain consistent. Handguns continue to be the preferred weapon selected by the perpetrators, and at least one was used in 77.8 percent of mass shootings carried out from 2023 to present (versus 75.1 percent for 1966–2022). By comparison, 40.7 percent of incidents involved at least one rifle and 11.1 percent involved at least one shotgun (compared to 29.9 percent and 15.9 percent, respectively, in the earlier data). It bears noting that two of the four most lethal mass public shootings carried out since the start of 2023—Monterrey Park, California (11 killed) and Half Moon Bay, California (7 killed)—were perpetrated using a handgun. Additionally, across the 27 new cases, 29.6 percent involved multiple weapons, which is more than five percentage points higher than the previous 57 years of mass shooting incidents.
What the Updated Data Tell Us
Since 1966, the prevalence and patterns of mass public shootings have remained largely consistent. As these tragedies continue, impacting communities and countless individuals across the nation, it remains imperative to work to prevent their occurrence. Existing policies, such as behavioral threat assessment and Extreme Risk Protection Orders (also known as red flag laws), show promise in helping to achieve this end. It is also critical to recognize that there is no “one size fits all” solution and that a multifaceted, layered approach to prevention is needed. Relying on evidence, such as that presented in our updated factsheet and series of policy briefs, is critical to ensuring that prevention efforts are focused and address the various aspects of mass public shootings in their data-informed, rather than anecdotal-based, context.
Supplemental Analysis for 1966–2022
| 2023 Policy Brief | Updated Data | |
| Number of Incidents | 441 | 466 |
| Number of Fatalities | 1,569 | 1,588 |
| Avg. Fatalities per Incident | 3.6 | 3.4 |
| Number of Injured Victims | 2,354 | 2,496 |
| Avg. Injured Victims per Incident | 5.3 | 5.4 |
| Location Types | ||
| Workplaces | 29.0% | 29.6% |
| Schools | 24.3% | 21.7% |
| Restaurant/Nightlife | 7.0% | 7.9% |
| Shopping/Entertainment | 5.7% | 9.9% |
| Government/Military | 4.3% | 4.3% |
| Place of Worship | 4.1% | 4.5% |
| Multiple Locations | 8.4% | 9.2% |
| Other | 17.2% | 12.9% |
| Weapons Used | ||
| Single Weapon | 67.3% | 66.7% |
| Multiple Weapons | 32.7% | 33.3% |
| Weapons: Type | ||
| At Least 1 Handgun | 75.1% | 73.4% |
| At Least 1 Shotgun | 15.0% | 16.1% |
| At Least 1 Rifle | 29.9% | 31.5% |
| Perpetrators: Sex | ||
| Solo Male | 94.3% | 94.8% |
| Solo Female | 3.4% | 3.4% |
| Male-Female Pair | 1.1% | 1.1% |
| Two or More Males | 1.1% | 0.6% |
| Perpetrators: Age | ||
| Average Age | 33.4 years | 34.4 years |
| Perpetrators: Race/Ethnicity | ||
| White | 54.1% | 57.1% |
| Black | 25.8% | 22.5% |
| Hispanic or Latino/a | 10.4% | 10.0% |
| Asian | 4.7% | 5.6% |
| Native American | 1.2% | 1.3% |
| Other | 3.7% | 3.3% |
Note: Percentages may not total to 100.0 percent due to rounding error or missing data. Perpetrator data is based on 474 shooters across 466 events. Race/ethnicity was not identifiable for 26 perpetrators (5.5 percent); accordingly, the respective percentages reported are based on instances where the race/ethnicity was known.
ABOUT THE AUTHORS
Jaclyn Schildkraut is the executive director of the Regional Gun Violence Research Consortium (RGVRC) at the Rockefeller Institute of Government.
Jaymi Elsass is an assistant professor of instruction in the School of Criminal Justice at Texas State University and an affiliate scholar with the RGVRC.
Emily Greene-Colozzi is an assistant professor in the School of Criminology and Justice Studies at the University of Massachusetts-Lowell and a member of the RGVRC.